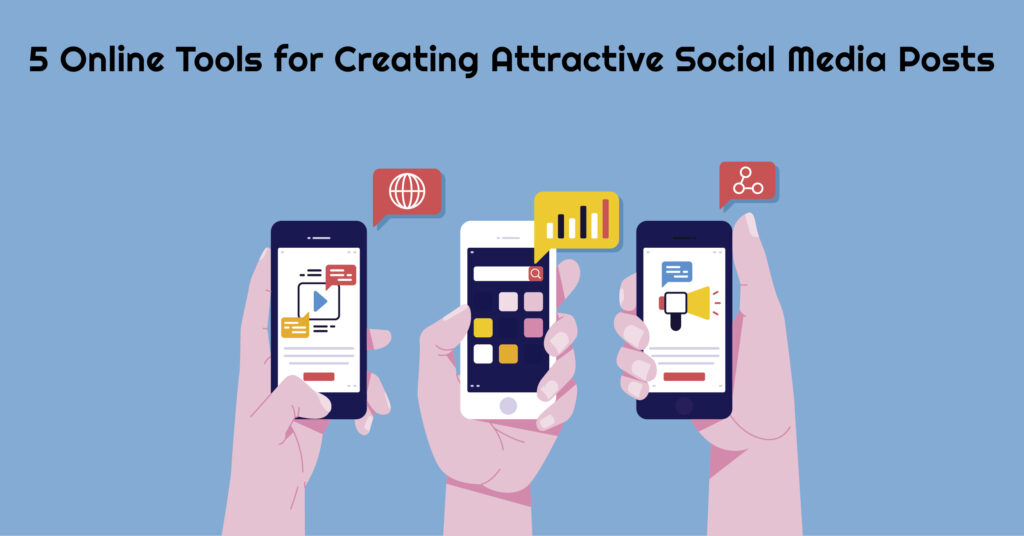
“A picture is worth a thousand words”—but what to do when your image is one of a thousand other images?
In this article we are going to discuss about the free tools for creating social media post
As a social media manager, you want to achieve the best result from each social media post. There has to be a good time and a bad time to post, right?
So how can you create images that stand out from all the other images in your audience’s Facebook, Twitter, and other social feeds? More importantly, how can you create images that drive engagement with your brand and traffic to your website or blog?
Well, for starters, you’re going to need a good design tool. Instagram filters and a slapdash text box won’t be enough. The good news is, there are a lot of tools out there to create engaging images that stand out on social media, and many of the best are free.
1. Canva
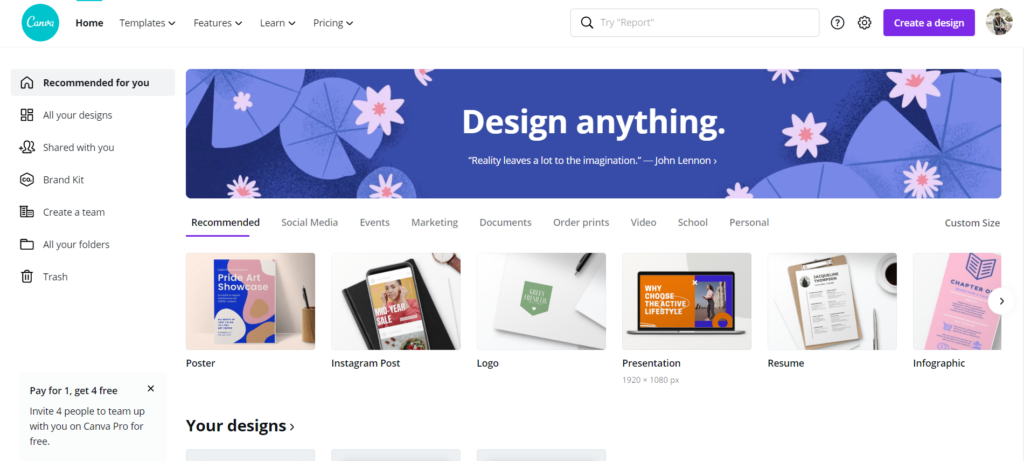
Best for powerful template-based graphic creation
In the 5 years since it was launched, over 10 million people have used Canva to simplify graphics design. With hundreds of templates, image and illustration assets, and dozens of fonts and text stylings, Canva makes it easy to create unique, high-quality images that are great for sharing on social media or your blog.
Canva’s free tools for creating social media post & simple drag-and-drop interface is accessible for relative beginners, but with an eye for design you can create some pro-quality assets with minimal effort. Of course, the popularity of the tool means you might need to work a little harder to customise the most popular templates to stop them looking like templates.
Preset sizes for various platforms are built in – including Twitter, Instagram, Facebook and Pinterest – and you can also work with custom dimensions for blog posts and other uses.
2. Adobe Spark
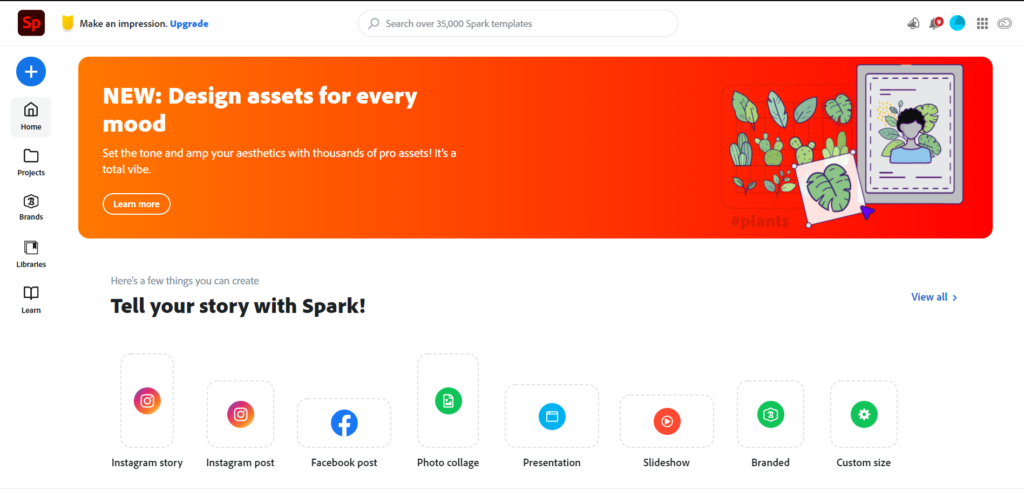
Looking for the perfect balance of minimalism and power in your design tool? Try Adobe Spark. Choose from dozens of professional templates sorted by industry category, design type (such as, social media images, Facebook covers, posters), and size, then customize that template with Spark’s easy-to-use tools.
Replace template images with one from Adobe’s royalty-free library, or one of your own uploads. Image adjustment abilities are minimal in Spark, but there are several basic filters available to let you adjust your image.
Adobe Spark is a free tools for creating social media post & fast content creation software that lets you easily combine text, images, and video content for better storytelling online. Spark lets you select the images you want. Upload your own from your device or cloud storage, or select from thousands of free online images.
Features of Adobe Spark
- Beautiful typography:- Choose from a variety of free professionally designed fonts and for every occasion.
- Iconic imagery:- Select from thousands of photos on the web or pick from your personal collections on Adobe Creative Cloud, Lightroom CC, Dropbox or Google Photos.
- Professional themes:- Explore our wide variety of best-in-class layouts, colors, and fonts. Easily tweak them with the text, photos, and icons that best fit your needs.
- Make an impact:- Watch your published creations make an impact as they receive views and likes from your audiences.
- Share everywhere:- Make your ideas come to life, then share your story via social media or email. Impress your friends or the world.
- Mobile and web:- Projects are automatically synced across the web or the iOS apps so you can work whenever inspiration strikes.
3. easel.ly
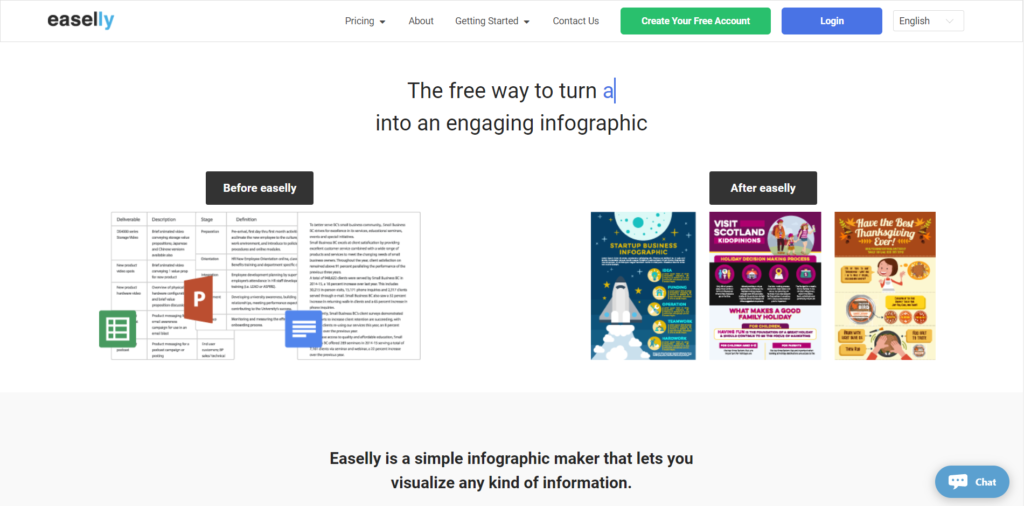
Some people use book length Word documents, others use PowerPoint decks that have thousands of slides and millions of bullet points! At Easelly we use infographics that are both fun to create and engaging to read!
Easel.ly is free tools for creating social media post & lives up to its name since this is a tool that builds sharp-looking infographics simply by modifying existing templates. The trick is making sure the templates available suit the information you want to convey. An infographic can add visual interest and emphasis to content through maps, graphs, charts, diagrams, flowcharts, and timelines and can also replace traditional text by grouping discrete pieces of information and showing the relationships between them. Because it provides a visual depiction of ideas, which in turn may provide students with a cognitive frame, Easel.ly can be used to create teaching aids. Because an infographic helps students visualize relationships between concepts, Easel.ly can also be introduced to students as a tool to synthesize and document learning. Easel.ly is a learner-centered tool because it readily provides a means for students to visually construct knowledge, to demonstrate connections they are making between concepts, and to personalize and differentiate their work.
Features of easel.ly
- Ease of use: Very easy to use for those with even limited experience manipulating shapes, objects, and text online. For those needing guidance, text-based and video tutorials are available through the site. (5 stars)
- Impact on Student Learning: Easel.ly can be used to create attractive visual aids for knowledge-based learning, as well as a student-centered tool for creating, applying, and synthesizing information. Especially valuable for visual learners, and may strengthen visual literacy. (5 stars)
- Power & Bias: Access to limited templates may restrict the user’s ability to depict information precisely or completely avoid image biases where depictions of people are included in the template. As a student-centered tool, Easel.ly relies on the user to ensure the information presented in infographics is free of bias or deception. (4 stars)
- Accessibility: This is a tool for presenting information visually, thus sight of the user is assumed. Multiple contrasting colors and zoom abilities may help for those with impaired sight. Because of the sometimes delicate and fiddly adjustments needed with online design, fine motor skills are also necessary to be successful with Easel.ly. Additionally, you can’t embed alternative text for images and icons, so screenreaders may not be able to see the detail provide by the infographic (3 stars).
4. Pablo
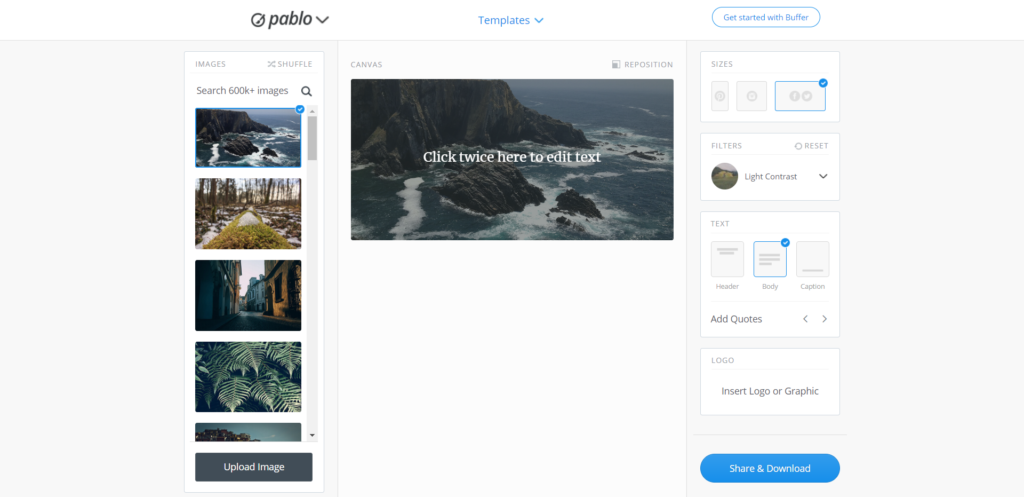
If you’re looking for free tools for creating social media post, then Pablo, by Buffer, is a good choice. It makes it easy to combine beautiful images with text, and includes filters. You can add your own logo, too.
You know that a strong social media presence is important—for your employer, your personal brand, and even your career. But most of us have better things to do than spend hours crafting the perfect branding for our social media images. Image customization is limited—choose from a few preset filters, designed to provide the right level of contrast between your image and your text. You can also add up to three text boxes. Pablo displays them as “Header,” “Body,” and “Caption,” but you can adjust size and font to redesign the text as you see fit. Add one adjustable logo or graphic, and you’re good to go!
5. Piktochart
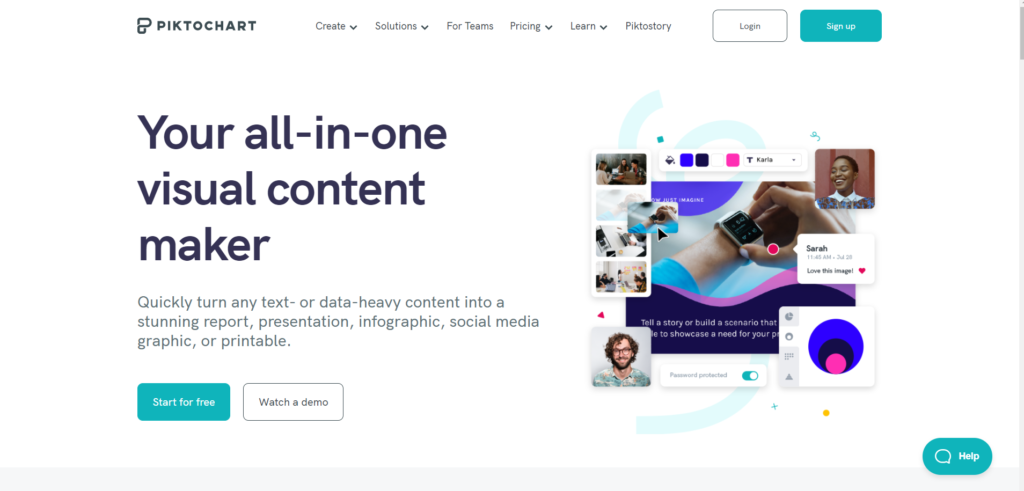
Piktochart is free tools for creating social media post & simple that you can immediately use it, without training. Start with a template designed by experts. Quickly get to a professionally-looking report, presentation, infographic, poster, or social media graphic that will help you drive the results you are looking for.
Customize to your brand in seconds. Drag your logo or a screenshot of your website to auto-magically extract your brand colors. Do you want to use your company’s fonts? No problem. Your custom color palette and uploaded fonts will always be accessible in the editor.
The times of searching for the perfect image, illustration, or icon are over. With Piktochart’s free library of graphics, designs components, and templates, the visual inspiration you are looking for is there where you need it. Making your content beautiful has never been so easy.
With Piktochart’s robust charts and maps you can quickly translate your data into a visual story that will grasp the attention of your audience. Link up an Excel or Google Sheets file to easily create graphs that automatically update when your data does. Add interactive maps to your presentation to highlight your main points.Get started